There's a running joke among Korean investors: if you want to know what KOSPI will do tomorrow, just check what the S&P did last night. For most of the past two decades, according to research, that joke has been roughly true. The long-run correlation between the two indices, measured on daily adjusted closes from 1997 to 2024, is 0.79 — high enough that "KOSPI follows the US" is a reasonable model.
Except when it isn't.
I first noticed this while extending Doctor Copper V2 to the Korean market. The macro regime model, built entirely on US and global signals, produced a larger Risk-ON minus Risk-OFF spread on KOSPI than on the S&P 500 itself. That surprised me. A model that knows nothing about Korea shouldn't work better on Korea. Unless the thing I was really capturing wasn't "US market direction" but something more general — and KOSPI's relationship with that something was less stable than I'd assumed.
So I went looking for the decoupling.
The Average Is a Lie
The top-line correlation of 0.79 hides a problem. When you plot the two indices together, they track each other through the 1997 IMF crisis, the dotcom bubble, and the 2008 financial crisis. But somewhere after COVID, the lines split.
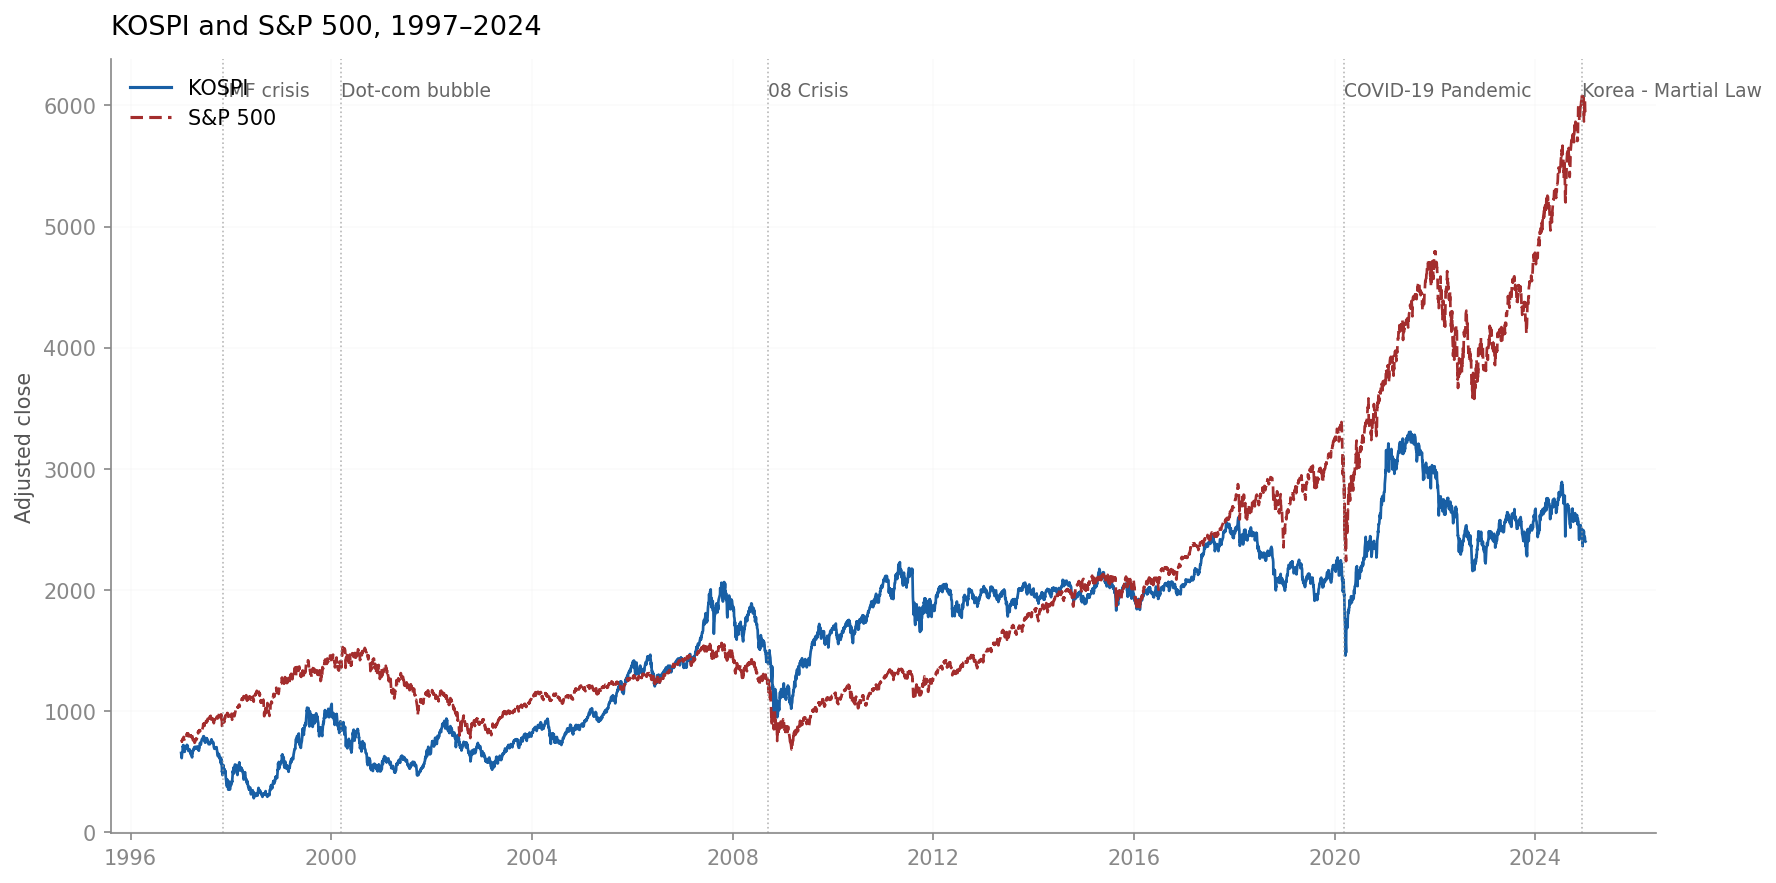
The S&P 500 nearly doubled between early 2020 and late 2024. KOSPI ended that period roughly where it started. The scatter plot of the two indices tells the same story in a different shape: a clean linear relationship up to S&P ~3500, then a long cloud of red diamonds that sits well below the regression line from S&P 4000 onwards.
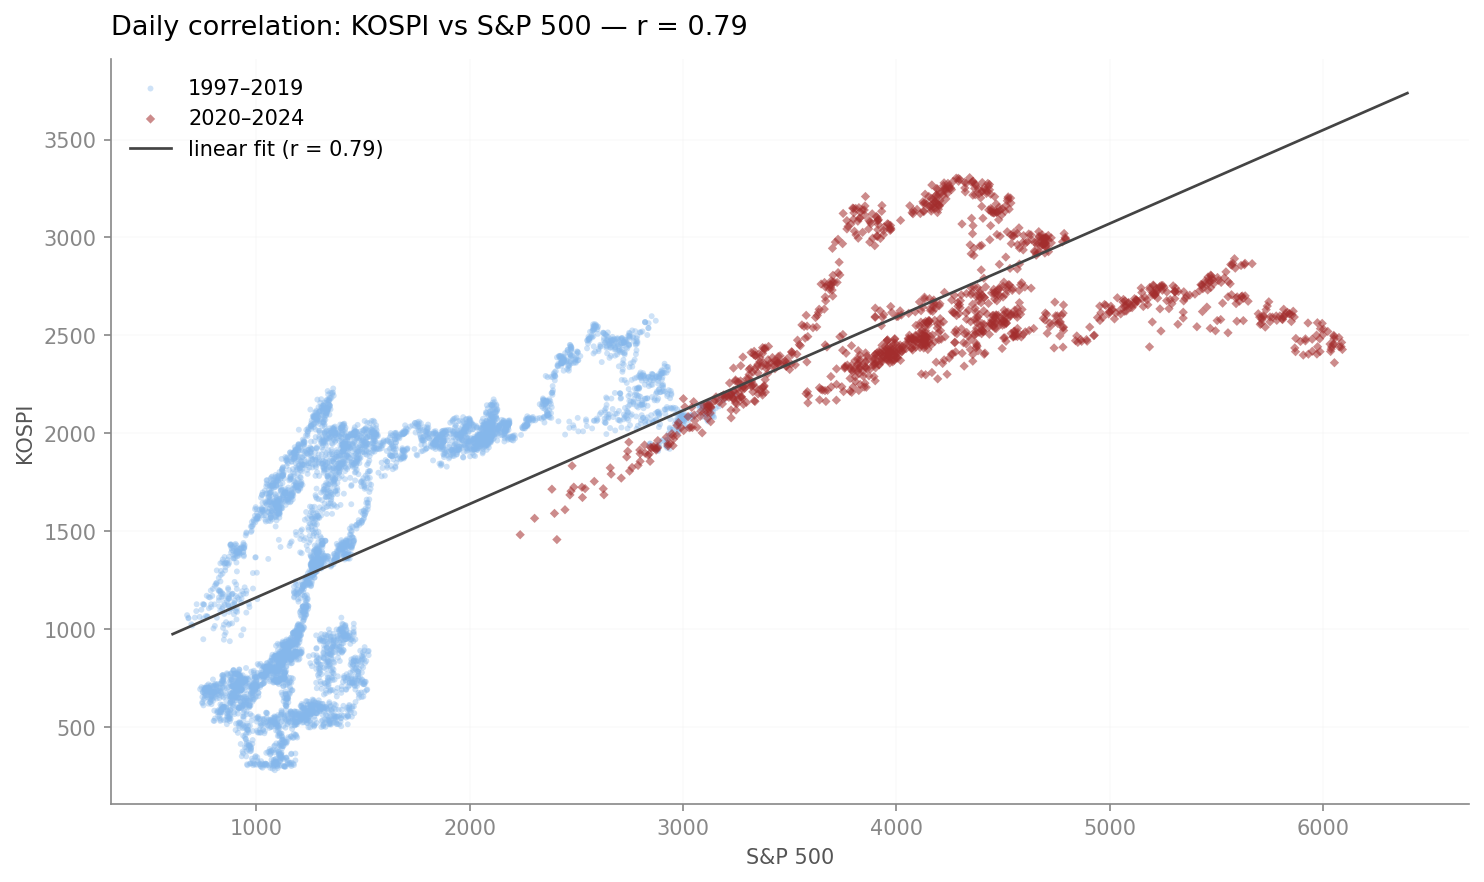
Look at where the post-2020 points (red) land relative to the fit. When the S&P was between 3000 and 4000, KOSPI briefly overshot the trend line — those are the 2021 Korean retail boom points. After that, everything lives below the line. S&P 5500, 6000 — KOSPI is stuck between 2400 and 2800.
The absolute price gap tells the cleanest version of the story.
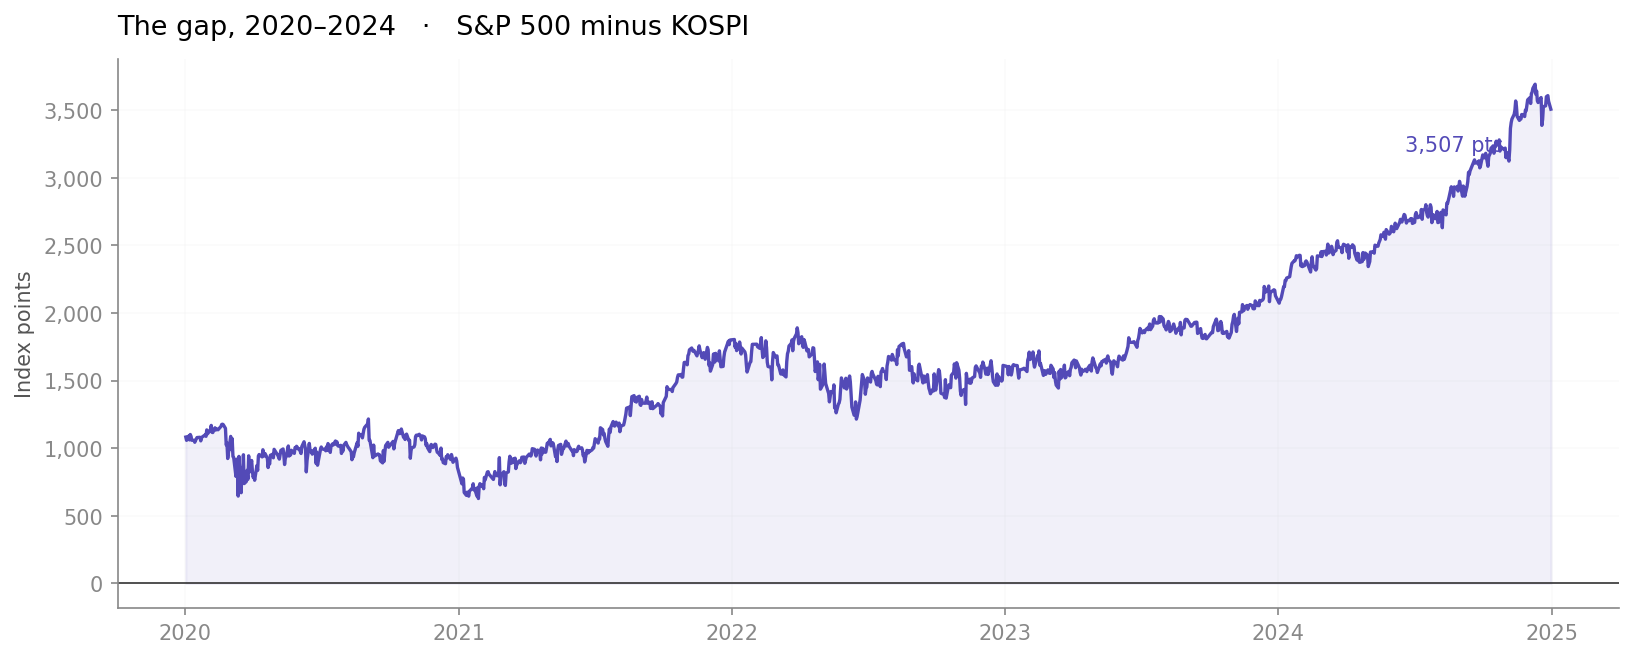
The S&P-minus-KOSPI spread started 2020 around 1,000 points and ended 2024 at 3,507 points — a 3.3x increase. It has not mean-reverted. The only extended drawdown was the 2021 retail rally, and that gave back in six months.
A correlation of 0.79 computed over 27 years describes almost no specific moment in history. The last four years in particular look like a different regime entirely.
Four Ways KOSPI Breaks from the S&P
The structural gap since 2020 isn't one thing. It's at least four things layered on top of each other.
1. The semiconductor cycle runs on its own clock.
Samsung and SK Hynix together make up roughly 30% of KOSPI's market cap. When memory prices collapse — as they did in the second half of 2022 — KOSPI can fall while US indices, driven by a different sector mix, keep climbing. This isn't really a macro decoupling. It's a composition problem. KOSPI is, to a first approximation, a memory chip ETF with a country attached.
2. China matters more than the US sometimes.
Roughly a quarter of Korean exports go to China. When Chinese industrial activity contracts, Korean earnings expectations follow, regardless of what's happening in American equities. The 2015 Chinese devaluation and the 2021–22 property crisis are the cleanest examples. During those periods, KOSPI's short-horizon correlation with the Shanghai Composite briefly exceeded its correlation with the S&P.
3. Dollar strength eats foreign capital.
When DXY spikes — 2022 is the reference case — foreign investors pull money out of Korean equities to avoid the currency loss. The selling pressure is mechanical, not fundamental. KOSPI falls even if nothing has changed about Korean companies. You can see this clearly in the gap chart: the spread widens sharply through 2022 even as the S&P itself is falling.
4. Local shocks that the US doesn't care about.
The December 2024 martial law declaration is the most recent example. A political crisis that would barely register in New York can dominate KOSPI for weeks. Add Japan trade disputes, North Korean missile tests, and chaebol governance scandals, and you have a steady stream of local noise that the S&P never sees.
The "Korea Discount," Reframed
Korean commentators have a name for the gap: the Korea discount. It's usually explained in structural terms — chaebol governance, low dividend payouts, geopolitical risk, the small size of the domestic market. All of that is probably true.
But from a quant's perspective, the Korea discount is just what decoupling looks like when it runs in one direction for long enough. It's not that KOSPI moves independently from the S&P in random noise. It's that the gap between them has a positive drift. The four decoupling mechanisms above aren't symmetric — dollar spikes, semiconductor downturns, and local political shocks are more frequent and more severe than the reverse.
What This Means for a Quant
The practical implication is uncomfortable for anyone running a simple long-short or beta-hedged book. Hedging KOSPI exposure with S&P 500 futures works on average and fails precisely when you need it most. The hedge breaks down during exactly the regimes that create the largest drawdowns — dollar spikes, China shocks, semiconductor downturns.
A more honest model of KOSPI isn't "KOSPI = α + β × S&P." It's closer to:
KOSPI ≈ f(global risk appetite, semiconductor cycle, CNY, DXY, local shocks)
The S&P 500 is one input among several, and its weight changes with the regime.
This is where a regime classifier becomes useful. The same logic I used in Doctor Copper — composite z-scores, rolling thresholds, walk-forward validation — can be pointed at this problem. The features are different (SOX index, USD/KRW, CNY, DXY, maybe a China PMI) but the structure is the same: identify which regime you're in, acknowledge that the regime changes, and size your exposure accordingly.
What I'm Still Unsure About
The hard question isn't detecting decoupling after the fact. That's easy — I can draw the chart. The hard question is detecting it in real time, before the drawdown happens.
Rolling correlation is backward-looking by construction. By the time it's dropped, the move has already happened. Leading indicators would need to come from the underlying drivers — DXY momentum, semiconductor spot prices, China credit impulse — rather than the correlation itself. That's the next project.
For now, the takeaway is simpler. KOSPI is not a lagged S&P 500. It's a function of three or four global variables, and the S&P happens to be correlated with most of them most of the time. When those variables disagree — when the dollar is ripping while US equities rally, or when memory prices are collapsing while NVIDIA reports earnings — the joke stops being funny.
The correlation is never the answer. It's just what's left over when you haven't asked the right question yet.
Data: Yahoo Finance via yfinance (^KS11, ^GSPC), daily adjusted closes, Jan 1997 – Dec 2024 · Code: github.com/junshin0922/kospi-spx-decoupling